
Are you at risk? Use our interactive tool to view the level of activity from fraudsters in your county. Either enter your zip or county name or simply click on the map. [iframe src=”/wp-content/themes/zap-installable/visualizations/irs-scam-counties/index.html?v=4″ width=”647″ height=”640″]
In our previous blog post, we recorded our interaction with the scammers by posing as the victim. We wanted to understand if the scammers are targeting individuals at random or are they targeting a particular demographic. We used our Phone Reputation Service databases to determine the location associated with the complaints associated with this scam.
Which counties are most targeted?
We plot the number of complaints by county on a map of the US; the darker the color of the county, the higher the number of complaints. Right away, some locations jump out at us. Several counties in Florida look quite dark, as well as the NYC, DC and some other big cities. Our initial assumption was that the number of complaints would match up well with the population of a region. We do see that to some extent – NYC, LA, Miami and other big cities show up prominently. However, several smaller counties in Florida (Lee, Collier) and California (Marin, Merced) also stand out. What’s different about them? 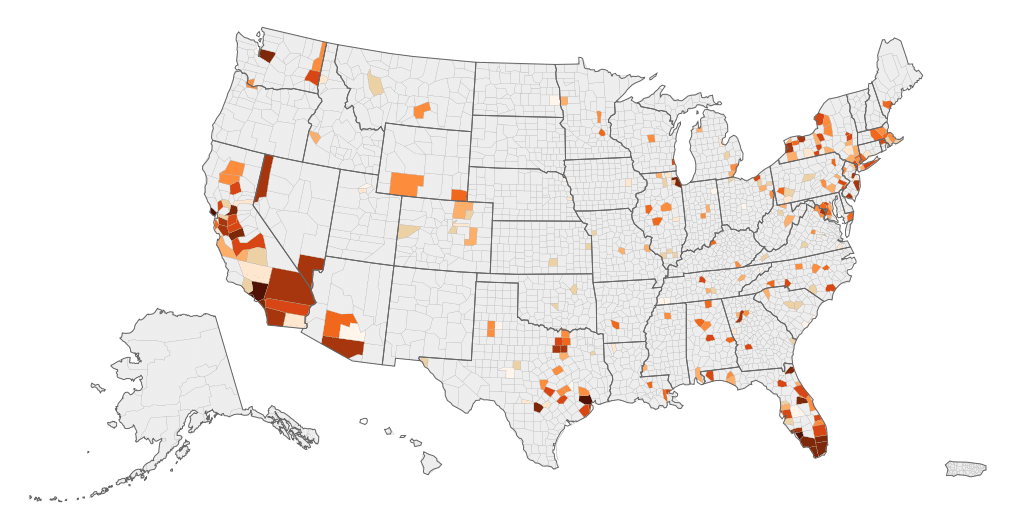
Are foreign-born people disproportionately targeted?
The American Community Survey (ACS) collects extensive data about the place of birth of people in the US to estimate the foreign-born population in each. As shown in the histogram, the general distribution of foreign-born people in US counties is very skewed. Most counties have a very small fraction of immigrants, in fact the median is about 2.5%, and only 5% of counties have a foreign-born population of 15% or more. 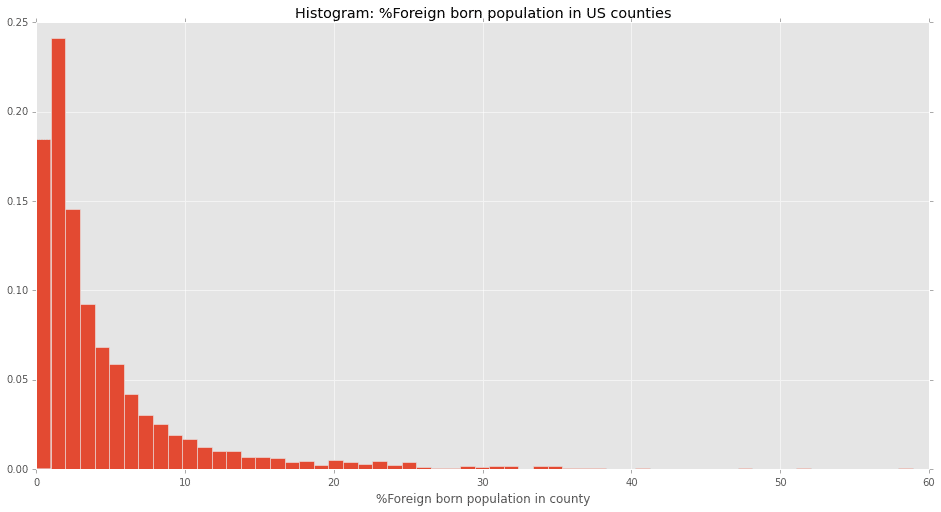
| County | State | #Complaints | Total Pop | Foreign-born Pop | %Foreign-born |
| New York County | NY | 3087 | 1619090 | 455248 | 28.51 |
| Los Angeles County | CA | 2094 | 9962789 | 3473930 | 35.30 |
| Lee County | FL | 1908 | 645293 | 93889 | 15.04 |
| District of Columbia | DC | 1598 | 632323 | 82048 | 13.54 |
| Harris County | TX | 985 | 4253700 | 1026719 | 25.03 |
| Marin County | CA | 817 | 256069 | 48375 | 19.14 |
| Duval County | FL | 770 | 879602 | 80953 | 9.34 |
| Collier County | FL | 754 | 332427 | 74640 | 23.07 |
| Miami-Dade County | FL | 735 | 2591035 | 1286234 | 51.20 |
| Cook County | IL | 662 | 5231351 | 1099425 | 21.15 |
| Orange County | FL | 589 | 1202234 | 220213 | 19.09 |
| Merced County | CA | 585 | 262305 | 64622 | 25.20 |
| Orange County | CA | 584 | 3090132 | 922303 | 30.52 |
| King County | WA | 568 | 2007440 | 394819 | 20.34 |
| Broward County | FL | 539 | 1815137 | 552669 | 31.37 |
| Baltimore city | MD | 527 | 621342 | 45956 | 7.40 |
| Bexar County | TX | 527 | 1785704 | 223995 | 13.02 |
| Sacramento County | CA | 431 | 1450121 | 281846 | 19.82 |
| Monroe County | FL | 420 | 74809 | 13224 | 18.00 |
| Washoe County | NV | 383 | 429908 | 63589 | 15.07 |
| Alameda County | CA | 382 | 1554720 | 463896 | 30.62 |
| San Diego County | CA | 365 | 3177063 | 720485 | 23.24 |
| Santa Clara County | CA | 349 | 1837504 | 658753 | 36.83 |
| Monroe County | NY | 342 | 747813 | 62139 | 8.34 |
| Dallas County | TX | 341 | 2453843 | 545938 | 22.95 |
What is the relative impact of each of these two factors? In order to tease that out, we plot the total number of complaints on a bubble scatter plot, with the two factors, immigrant proportion and overall population as the axes. The size of the bubble indicates the number of complaints from the corresponding county. 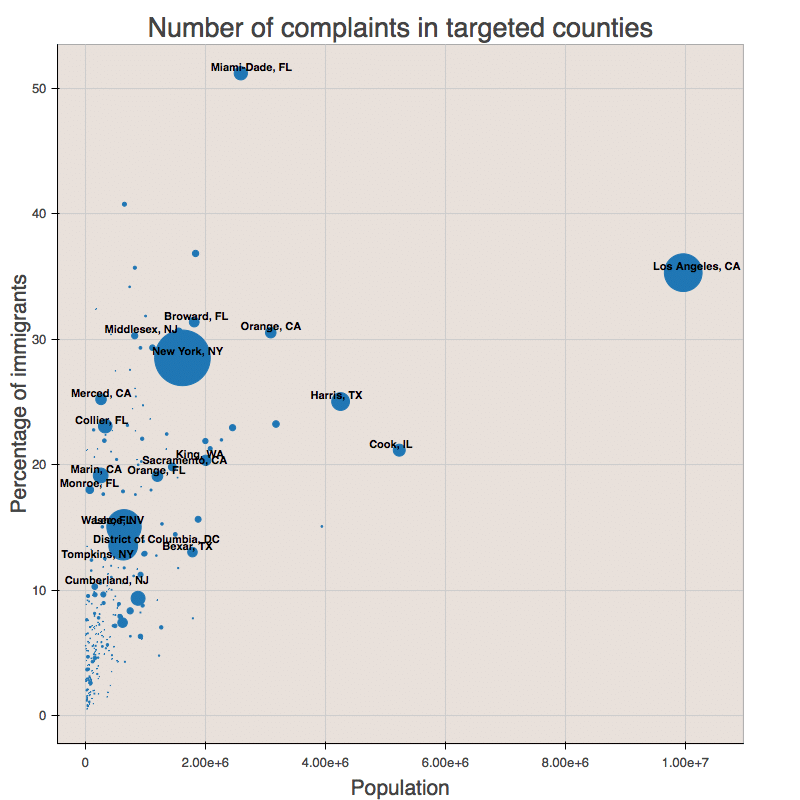
Raj Bandyopadhyay, Peter Casanova, Philip Thrasher


